Datatables and Highcharts - table.on('draw' and function chartData(table)

Datatables and Highcharts - table.on('draw' and function chartData(table)

carrarachristophecarrarachristophe Posts: 99Questions: 23Answers: 2

Hello,
I managed to buid a Highcharts more or less the way I wanted based on a table that is similar to what I can get through Datatables, see working example. Unfortunately, when I link the Highcharts to my Datatables, the Highcharts is blank, probably beccause I am missing the

table.on('draw', function () {
});

and the

function chartData(table) {
}

parts of my js, as described here or here.

Would you know how I could write these parts to fit my case? I don't need to count, sum or average the data, but just read the value in the Datatables.

Answers

  • allanallan Posts: 61,863Questions: 1Answers: 10,136 Site admin

    probably beccause I am missing the [...] parts

    Given that those are the parts that populate the chart, you are spot on :)

    You would use the rows().data() method to get the data from the table, and then plot that into Highcharts using their API. Perhaps you can show us what your DataTable looks like?

    Allan

  • carrarachristophecarrarachristophe Posts: 99Questions: 23Answers: 2

    Hi Allan,

    Thank you for your message.
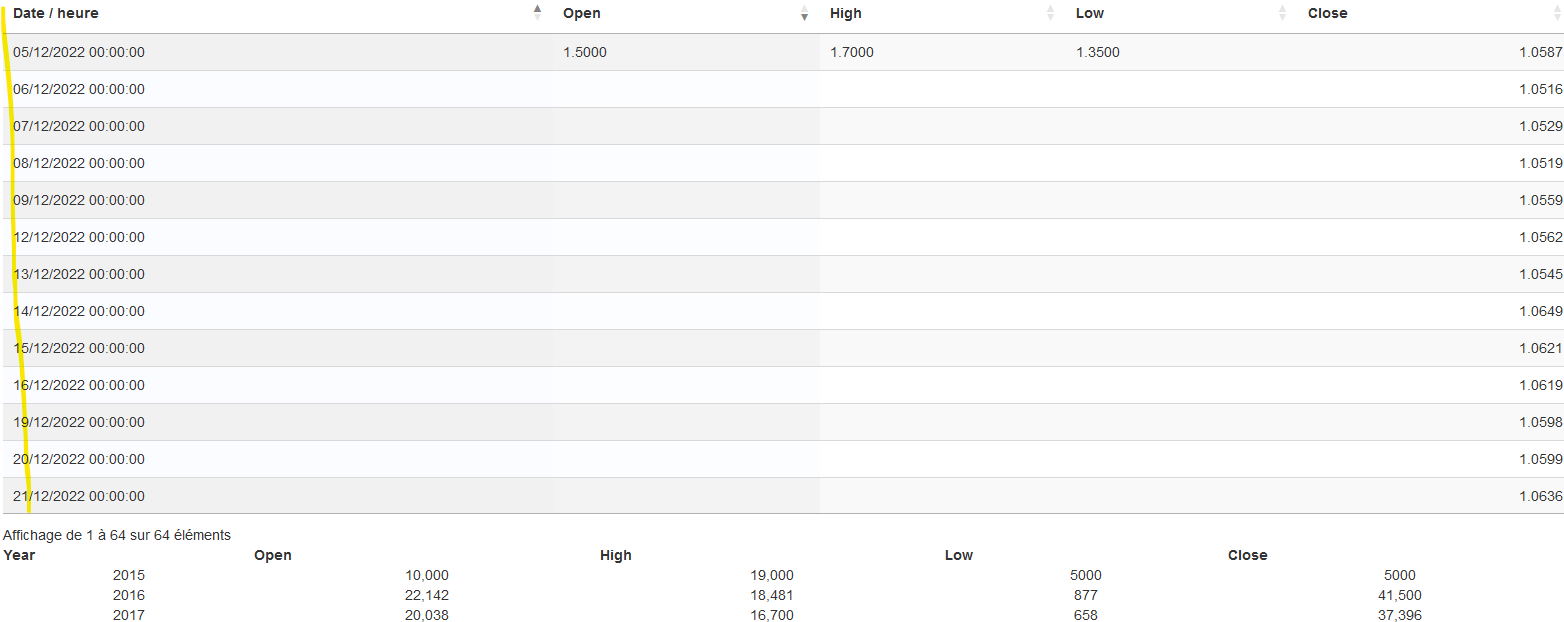
    My datatable is highlighted in yellow. It contains the same columns as the table of my working example.

  • allanallan Posts: 61,863Questions: 1Answers: 10,136 Site admin

    That's one axis (presumably horizontal). Is the data in the 5th column the one you want to plot it against? If so:

    var myTable = new DataTable.Api('#myTable'); // or $('#myTable').DataTable();, `table` if you already have it, etc
    
    var xData = myTable.column(0).data().toArray();
    var yData = myTable.column(4).data().toArray();
    

    That uses column().data() to get the data for the column selected.

    Allan

  • carrarachristophecarrarachristophe Posts: 99Questions: 23Answers: 2

    Hi Allan,

    I am sorry but I don't know how to use this information.
    Here is my code

        var table = $('#quotes').DataTable( {
            ajax: 'php/table.quotes.php',
            columns: [
                {"data": "currency_rate.quote_datetime"},
                {"data": "currency_rate.quote_open"},
                {"data": "currency_rate.quote_high"},
                {"data": "currency_rate.quote_low"},
                {"data": "currency_rate.quote_last"}
            ]
            });
            
    //  var xData = quotes.column(0).data().toArray();
    //  var yData = quotes.column(4).data().toArray();
            
        var chart = Highcharts.chart("container", {
            data: {
                table: quotes,
                complete: function(options) {
                    options.series.forEach(series => {
                        series.data = series.data.map(function(data) {
                            if (typeof data[1] === 'string') {
                                return [data[0], parseInt(data[1].replace(/,/g, ''))];
                            } else {
                                return [data[0], data[1]];
                            }
                        });
                    });
                }
            },
            chart: {
                type: 'line',
                displayErrors: true
            },
            accessibility: {
                enabled: true
            },
            title: {
                text: "Test Data"
            },
            xAxis: {
                type: 'category'
            },
        });
    
    
  • allanallan Posts: 61,863Questions: 1Answers: 10,136 Site admin

    Here is a simple example based on the HighCharts link you gave originally: https://jsbin.com/dohejepido/1/edit?html%2Cjs%2Coutput= .

    I've only done a single series - the rest can readily be added.

    Allan

  • carrarachristophecarrarachristophe Posts: 99Questions: 23Answers: 2

    Hi Allan,
    Thank you.
    I will work on trying to add some more columns, but this time, when I apply the code to my Datatable, I get the following error message: "Uncaught TypeError: d[1] is undefined".
    I don't understand as both tables are very similar.

  • kthorngrenkthorngren Posts: 20,379Questions: 26Answers: 4,781

    Can you update Allan's example to show the issue so we can take a look?

    Kevin

  • carrarachristophecarrarachristophe Posts: 99Questions: 23Answers: 2

    The problem is that I cannot update Allan's example because I get no error message with the table id="example1", which works fine.
    The error message comes when linking the Highchart to my "real table".
    I will try to give access.

  • allanallan Posts: 61,863Questions: 1Answers: 10,136 Site admin

    Yes - we'll need to be able to see the issue to be able to offer any help debugging it.

    Allan

Sign In or Register to comment.